If you are a regular reader, you should know that Mrs. Nomad Numbers and I are both avid explorers who decided to embrace our passion for travel by making the world our home. By deciding to become nomads, we had to figure out how to plan our finances for a year. I think we plan well as we were not too surprised to see that we spent less than 15K during our first 6 months of nomadic travel which helped us cut our cost of living expenses in half compared to what we used to spend back home!
This post is part of our “behind the scenes” series where we share how we run our lives since we started our nomadic life.
For the second post of this series (you can check previous posts here), I will be sharing how we track our expenses and developed a cost of living index that we use to share our travel expenses via our destinations reports or weekend guide articles.
We will also be sharing this tracking system with you for free, so let’s dig in!
Note: If you don’t want to keep reading more but want to get our tracking resource right away, you can get a copy of it by filling out the form below:
Part #1 – Capturing expenses on the go
The first step that we had to take was to capture our expenses and make sure we were not forgetting anything. I started with a note on my phone that I updated with everything we purchased. While this was a low touch approach, this was pretty cumbersome and I sometimes forgot to capture something important (like who paid what) which messed up the reporting later on. So came Splitwise to the rescue.
Splitwise is a free app (available on desktop/web, iOS and Android devices) that lets you track and split your expenses between people anywhere you go. The app was designed initially to help roommates split their bills together and has since been taking off. Splitwise lets you capture your expense amount, who paid for it, what expense category it is, how it should be split and you can even attach the receipt associated with it. The app supports an offline mode which was a key selling point for me.
Note on splitting expenses: it is important for us to know who pay for what because we keep and track our finances separately. This might not be a requirement for you if your finances are in a single/common stash.
While the app is free, the team offers some paid features such as automatic itemization of each line item from your scanned receipt (its really impressive to see it in action), advanced search, advanced reporting and automatic currency conversion that can be really handy once you become a world traveler.
I have been using Splitwise for more than 5 years now and I don’t know how I would be capturing my daily expenses without it. Here is what my workflow looks like:
Step #1: I fire up Splitwise from my mobile device.
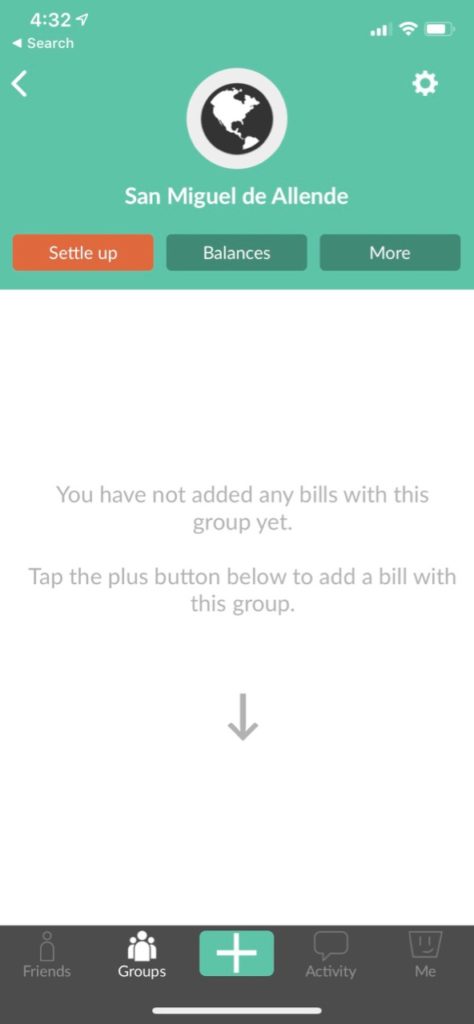
Step #2: I select the group (or create one) for which I want the expenses to be recorded under, in this example I will pick San Miguel de Allende, Mexico.
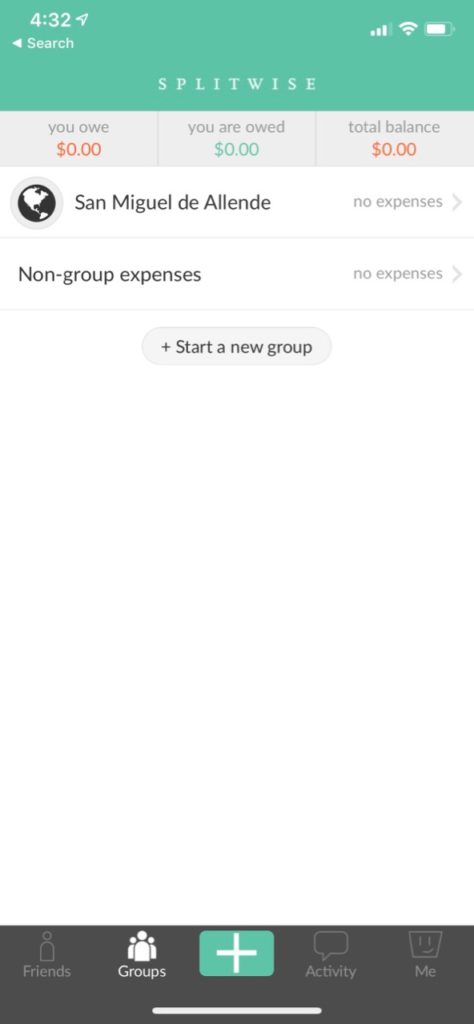
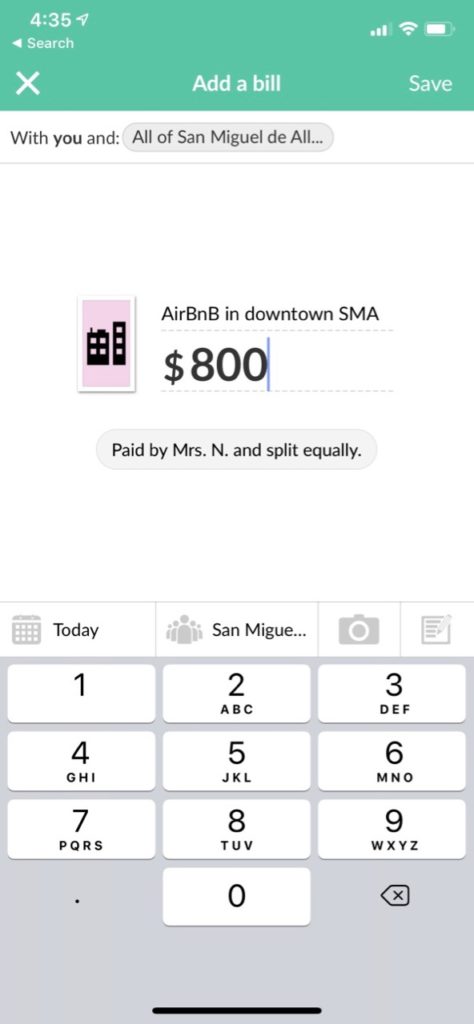
Step #3: I then enter my expense by clicking the “+” button. I fill out the basic expense information like a short description, the amount and the expense category.
Step #4: I then attach a copy of the receipt by using my phone’s camera. I found this handy to reduce our clutter as I don’t have to carry the physical receipt with me.
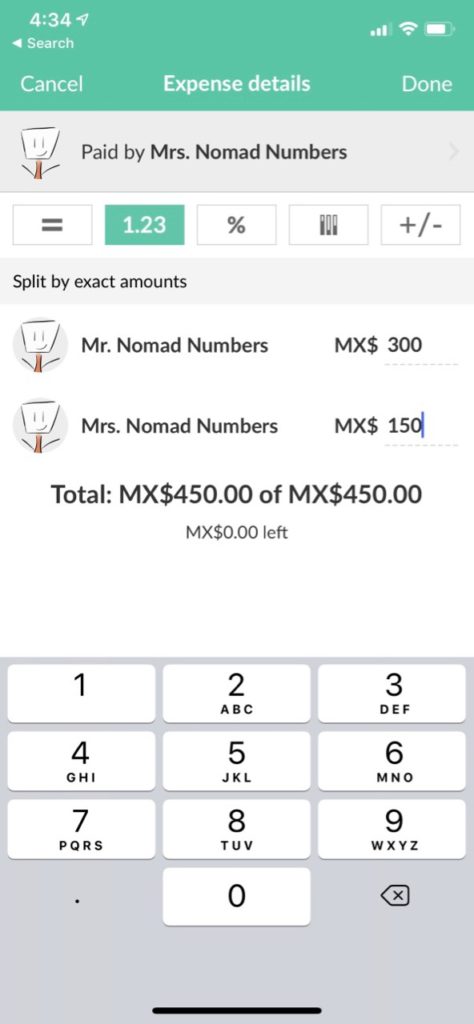
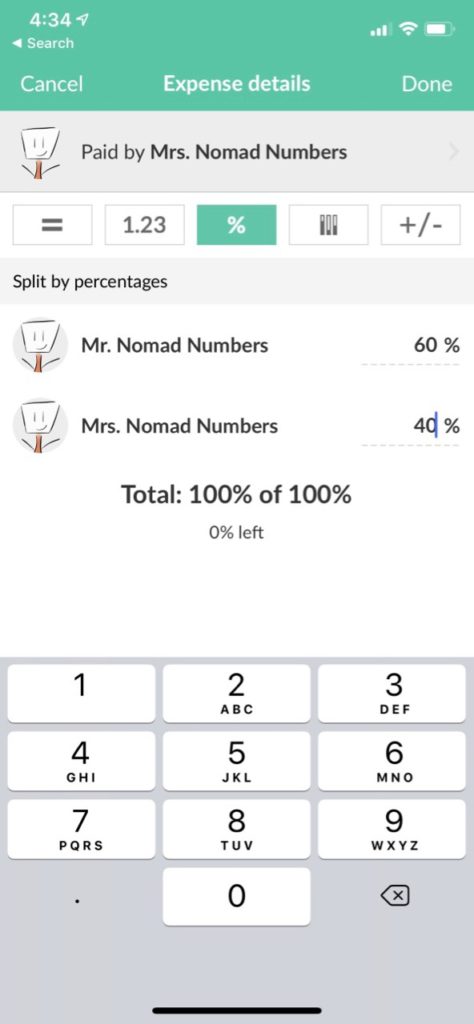
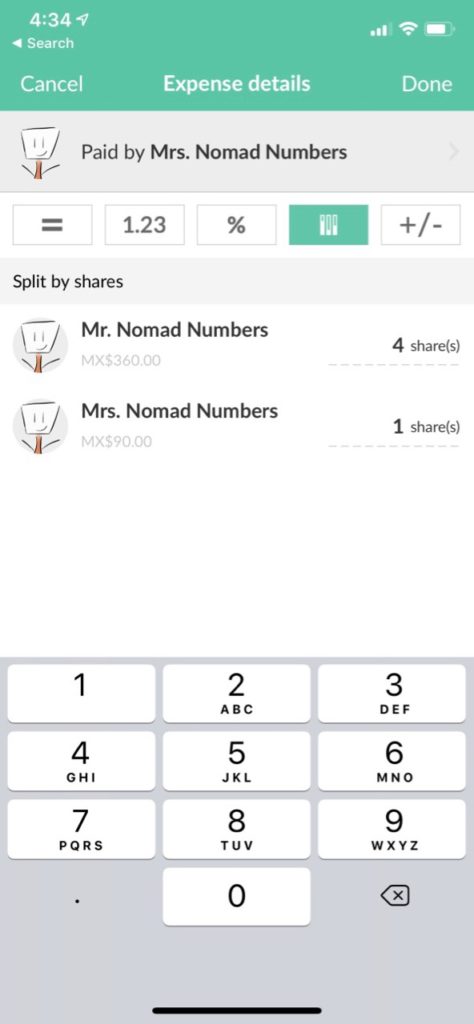
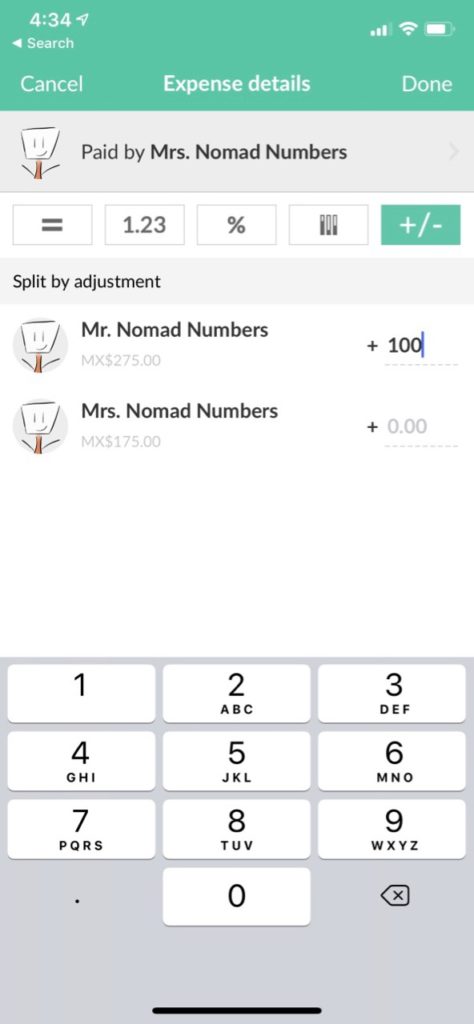
Step #5: I then indicate who paid for the receipt and how it should be split. This let us track every expense, even the ones we don’t want to split which is pretty handy to look at our overall spending. The app has many ways to split expenses, which is really powerful.
And we are done. I keep repeating these steps for each expense on our trip.
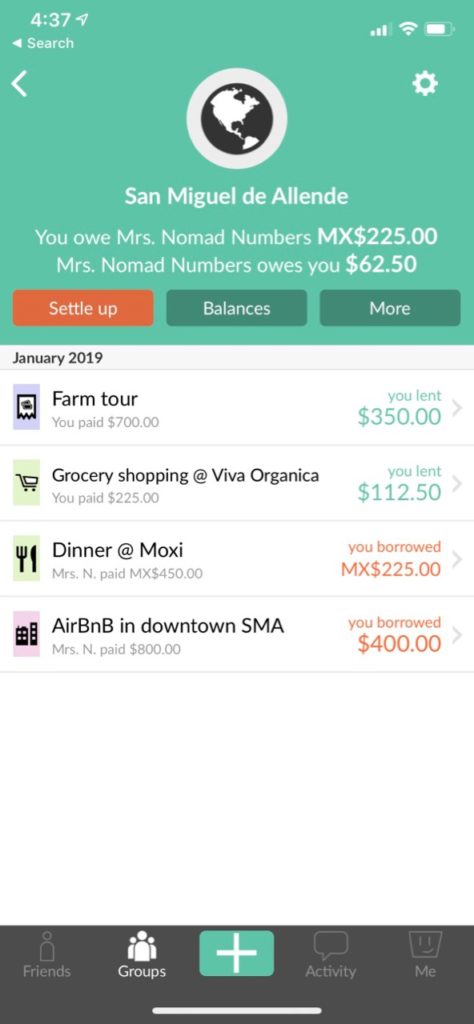
By looking at the “Groups” tab, Splitwise gives me an at a glance view of how much money people owe each other for a given group. By clicking the “cogwheel” icon on the top right, I also have access to some very basic reports.
Part #2 – Generating expense reports
While Splitwise has some reporting capabilities, it can’t support our needs which are pretty specific. When we decided to come up with a cost of living for each place we are traveling to, we wanted to answer the following questions:
- What is our true daily cost for any cities we have been traveling to. While this may sound easy, Splitwise doesn’t have a notion of a trip so you need to manually divide the total expense by the total number of days of your trip. Also some of our expenses (like flights) should not be included in our cost of living index as they will greatly change based on where we flew from.
- What is the breakdown of our living expense categories. Splitwise can provide some of that on their paid subscription but since our categories are different, this isn’t useful. Also we need to exclude some categories from our breakdown which Splitwise doesn’t let us do currently.
- How much an item costs for any given category. This is especially important with “Groceries” and “Restaurant” categories since we like to compare the cost of a meal at home vs a meal at a restaurant. This helps us identify where we should splurge eating out and where we should be more careful and instead find the best farmers market to eat our own food at home (& also make sure we can have a comfortable kitchen in the place we are staying).
- Comparing each cities side by side. So we can have an at a glance view when we plan our next trips, like the graph below of the places we travelled to in 2018.
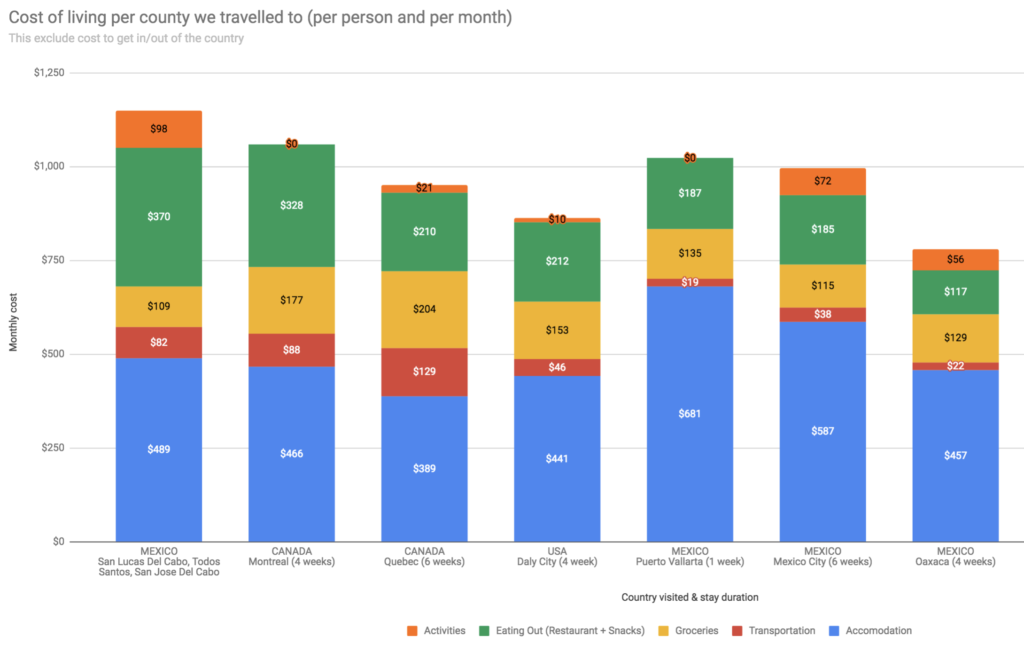
This is where Google Sheets came to the rescue. We are using a master spreadsheet that helps us generate all the reporting we need is less than 5 minutes. Let’s see how we are doing this:
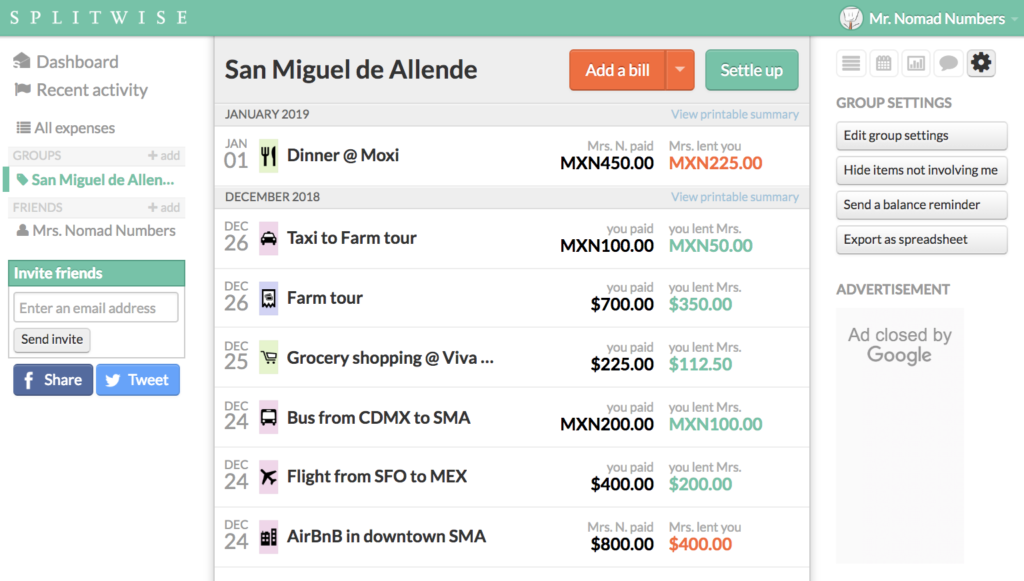
Step #1: We export the data from Splitwise in a CSV format. To do so, we access the application from a web browser, select the group we want (on the left), click the “cogwheel” (on the right) that brings up the “Group Settings” panel from which we can select the “Export as spreadsheet” option.
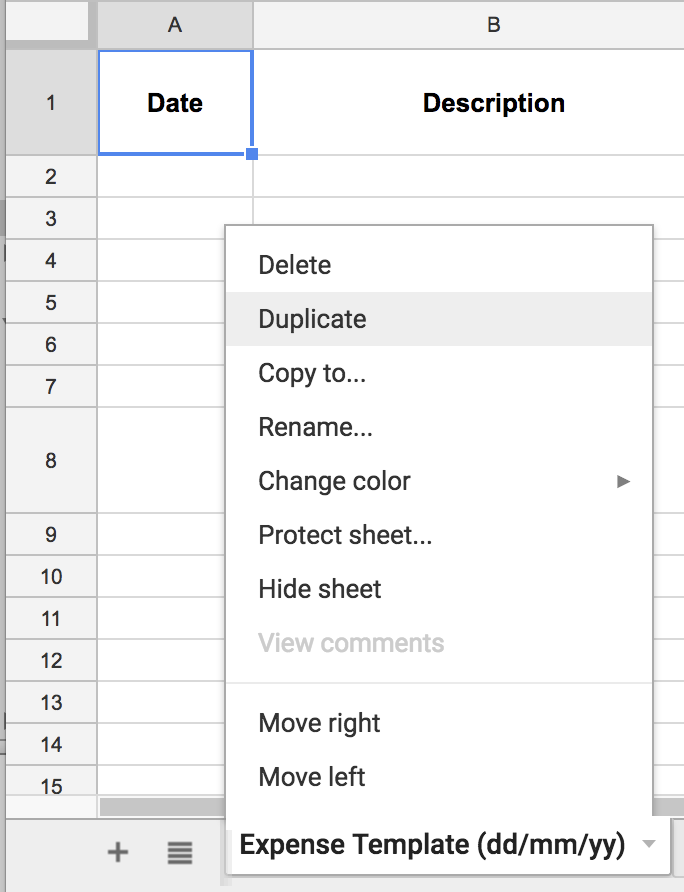
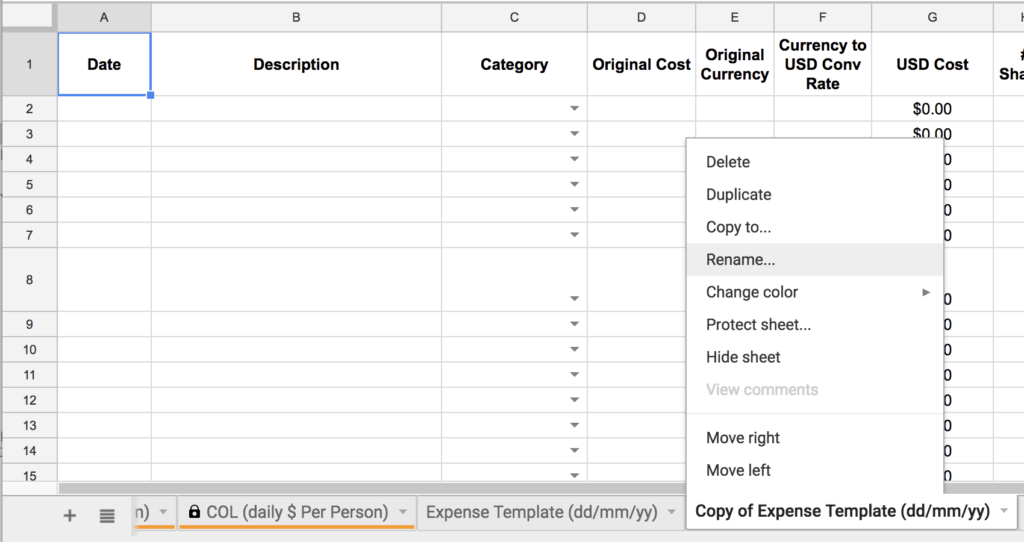
Step #2: From our master Google Spreadsheet, we duplicate our budget sheet template “Expense Template (dd/mm/yy)” into a new sheet. We then rename this sheet to match the destination we are creating a budget for.
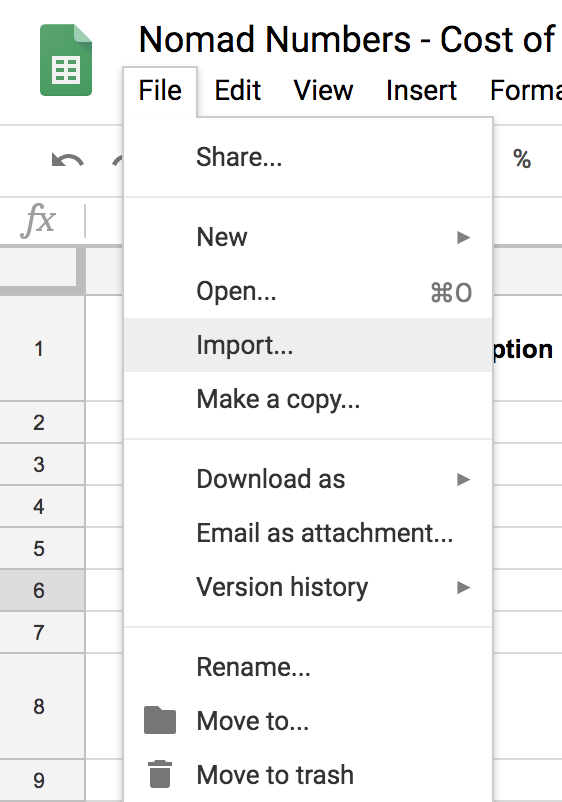
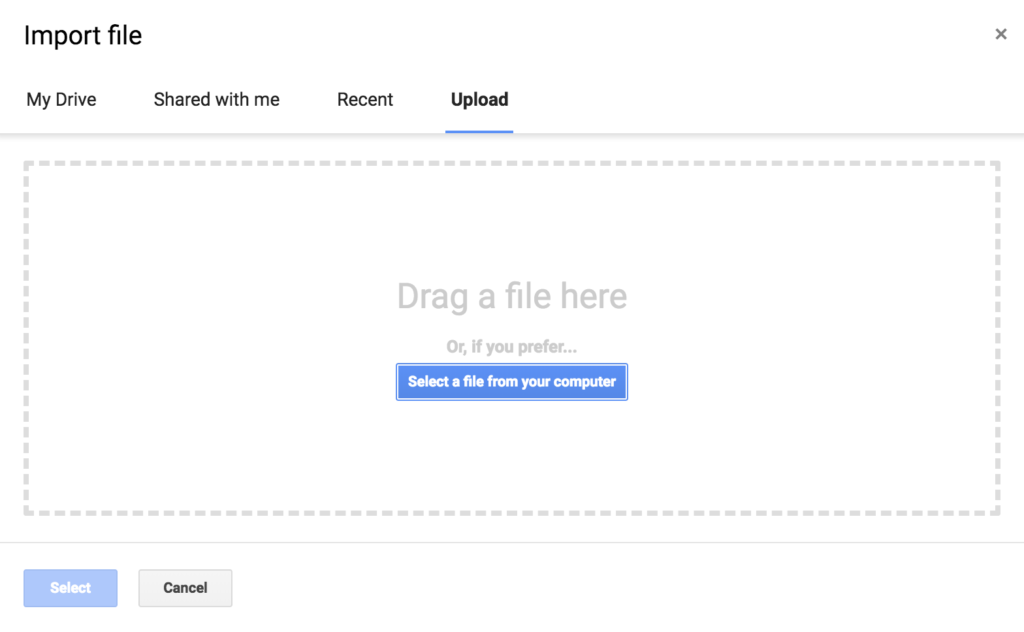
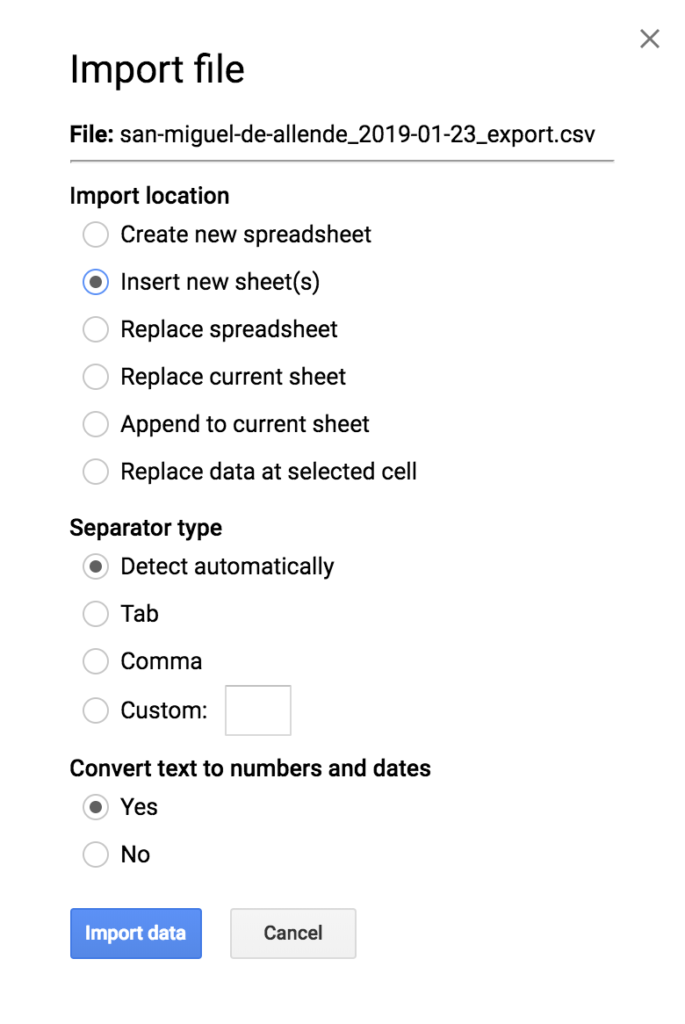
Step #3: We Import the data from Splitwise into the Google sheet through the “Import…” menu.
We then get something like this:
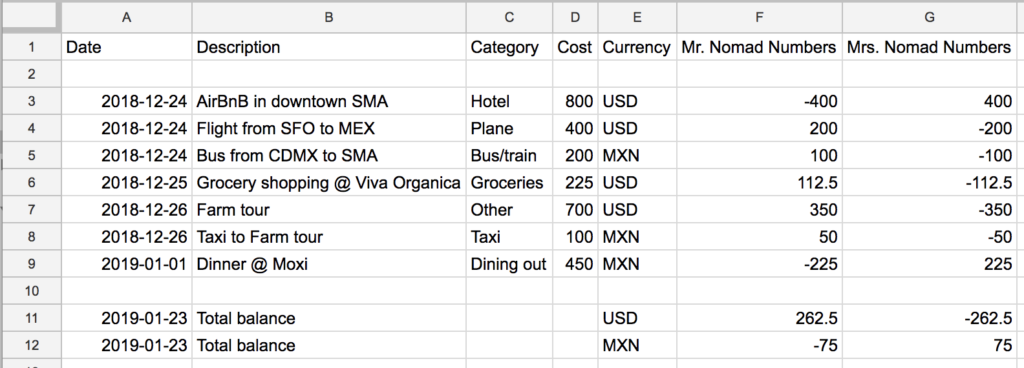
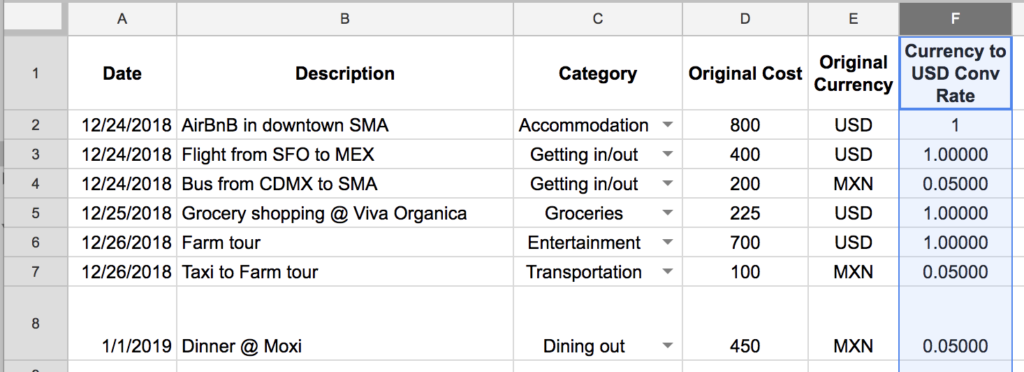
Step #4: We select & copy the data into our newly created budget sheet. For that, we select from row #3 and stop before the lines that have “Total balance” in their description. We only include in our selection the data for the following columns: “Date”, “Description”, “Category”, “Cost” and “Currency” (see the next screenshot).
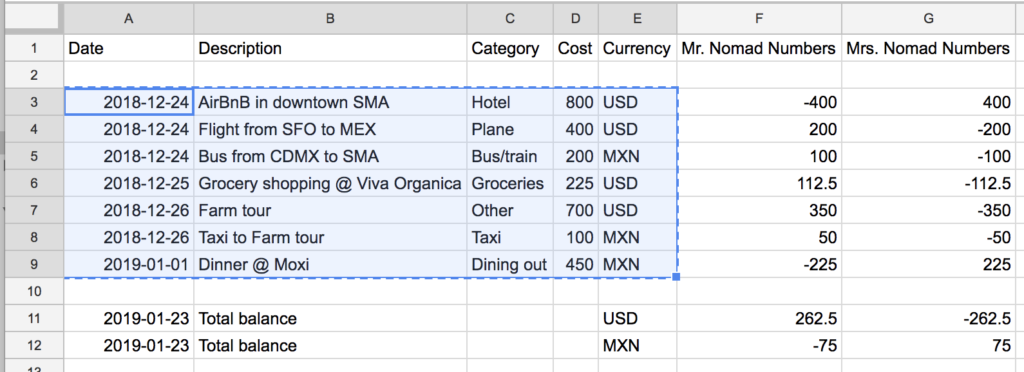
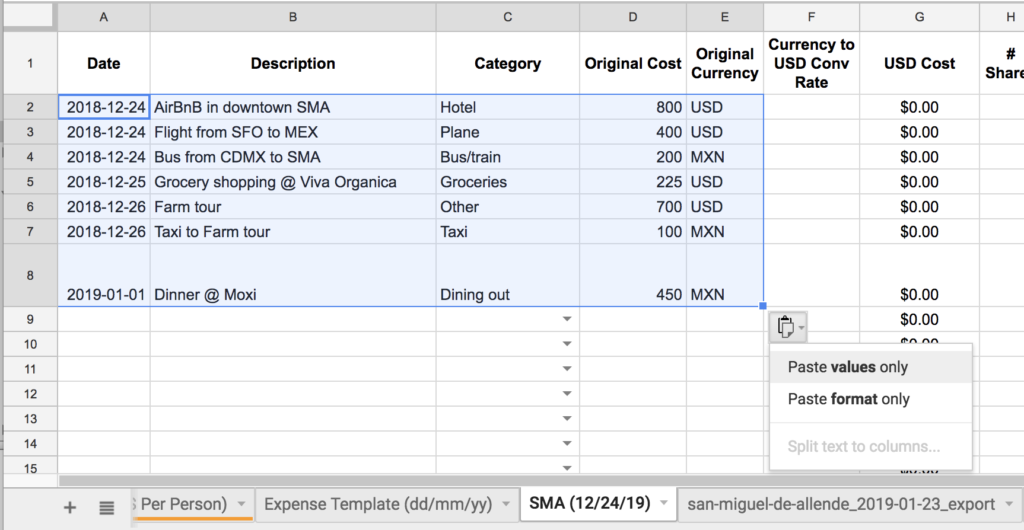
Step #5: We paste our selection at the top of our budget sheet. Note: once we paste we make sure to click the clipboard icon and select “Paste values only” so that the formatting and validation of the sheet doesn’t get overridden.
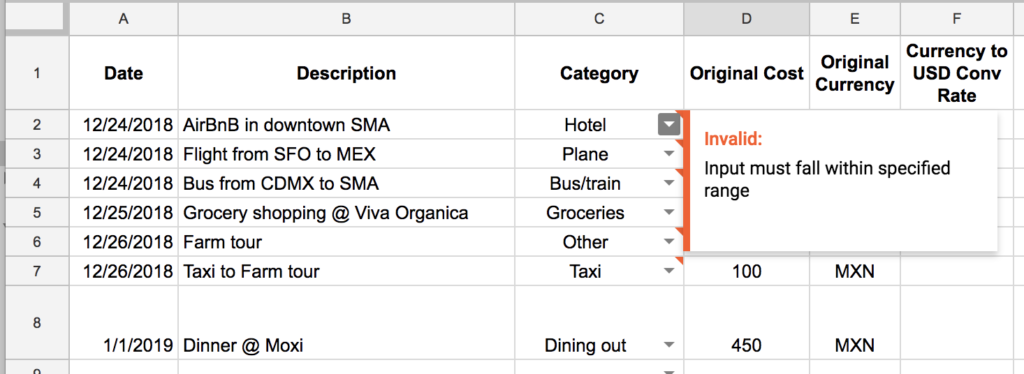
Step #6: We validate that each line item is appropriately categorized. Note: The categories in our spreadsheet can be adjusted though our “Metadata & Setup” tab of our spreadsheet.
Step #7: We populate the following columns: “Currency to USD Conv Rate”, “# Shares” & “Transaction Type”.
- “Currency to USD Conv Rate” – This column contains the conversion rate from the local currency if it is not USD. If it is USD then we put 1 in this column.
- “# Shares” – This column tracks how many “servings”/“persons” a given purchase was made for. This is used mostly to calculate the average cost of a specific category, especially when we capture expense which are not shared equally among all trip members.
- “Transaction Type” – This column helps us track our cash vs credit card (CC) spending among us. We can also personalize this by using the “Metadata & Setup” tab of our spreadsheet.
Step #8: We update the Trip information by indicating when the trip start/end and how many people are on the trip. The sheet then calculates based on the expenses how many meals were at restaurants and deduct how many meals at home. Yes, we are a bit crazy when it comes to our food consumption!

And we are done with this sheet!
We can then review the reporting available to us which is broken down into 3 tables:
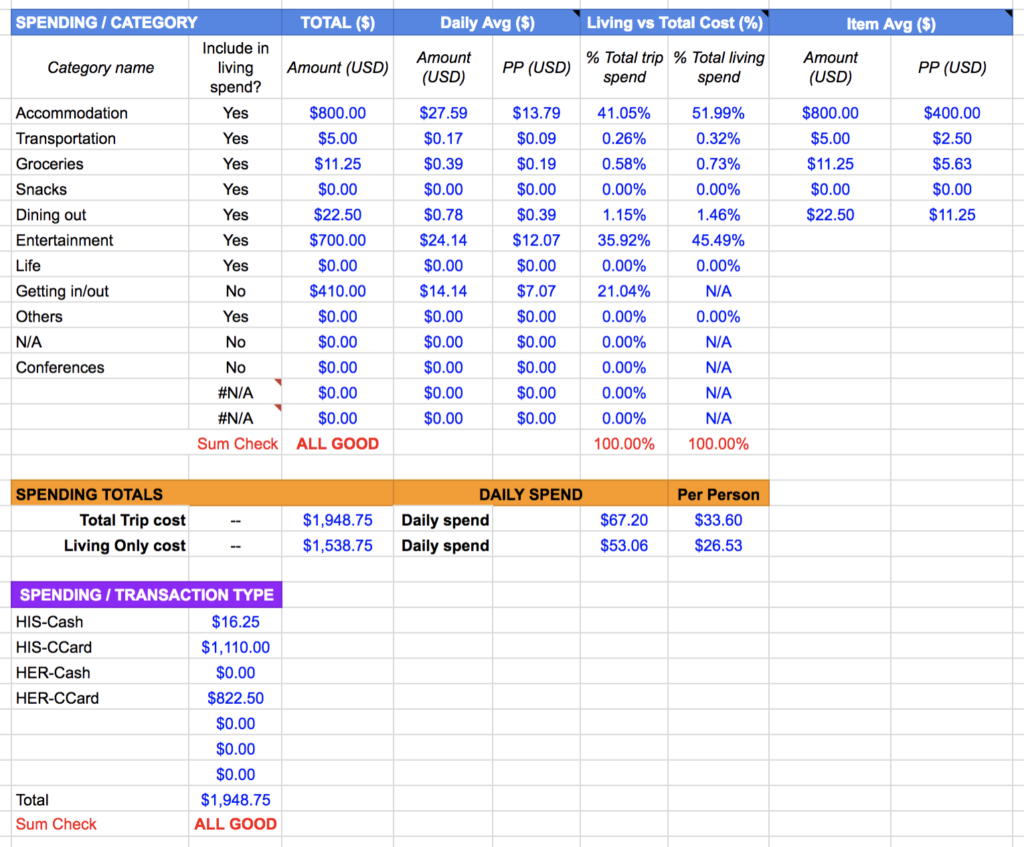
- “Spending / category” – This table gives us a breakdown of our spending for each category and provides the daily average for the # of people on this trip as well as for each individual. We can also see how much this category represents towards the entire total trip budget, the total living budget and the average cost per item for each category. We mostly use this to evaluate what is the average cost of our meal when we go out or when we cook at home.
- “Spending Totals” – This table provides our total budget cost as well as the total excluding any non living expenses. We like looking at them separately since we want a true cost of living which should not include cost to get in/out for a given place as well as any one-time expenses that we don’t expect to occurs if we would come back. This table also gives us the daily spend for the entire party as well as per person on this trip.
- “Spending / Transaction Type” – This table provides the breakdown of the total budget on this trip for each type of transaction. We use that to compare how much spending we put on our credit card vs cash.
Note: There are two “Sum Check” cells on this sheet that are here to perform some basic validation. As long as they say “ALL GOOD” then everything has been correctly entered. We use validation on our spreadsheet to make sure we catch any data entry issues.
If we would only want to do the budget for a destination we would stop there. However since we are world travelers, we want to build an extensive Cost Of Living index and compare each location between them so we have a tiny bit more work to do.
Step #9: We move to the “Summary (data)” tab and duplicate the 2nd row. We then update both Column B and D.
- “Location” – This is the name for the place we travel to. We like to use the format: “<Country name> – <City name> (# weeks)”.
- “Sheet Name” – This is the name of the sheet that we previously created to track the budget expenses. The name have to match.

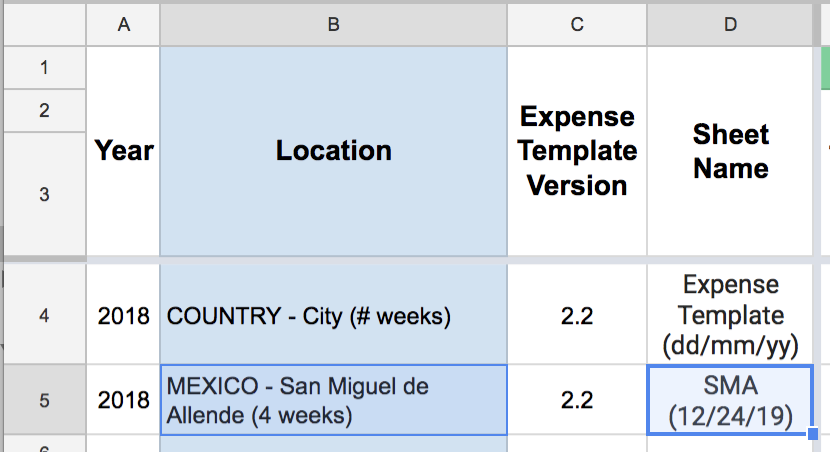
And now we are finally done. The row will then auto populate itself with the following information:
- Summary of the trip: Trip start/end date, # of nights, # of days, # of ppl.
- Total cost of the trip: Total trip cost + Total living expenses for the entire duration of the trip, Total living expenses for the entire duration of the trip per day and Total living expenses for the entire duration of the trip per day per person.
- Cost breakdown for each trip category.
- Cost of food: Average cost of a meal eaten at a restaurant and at home, estimated cost of eating exclusively at home for one day and the ratio between cooking at home vs going out.
- Daily spending normalized on a 30 days period for all the living expenses.
- Estimated yearly budget if we would like to live at this location for an entire year.
This information is then added to both “COL (monthly $ Per Person)” and “COL (daily $ Per Person)” tabs that generate our Cost of Living graphs for respectively monthly and daily spend per person.

Sharing the love
If you have been looking for a Do It Yourself (DIY) cost of living / budget tracking solution we are making our spreadsheet available to you at no cost. Simply fill out the form below and we will send you a copy of our spreadsheet to you instantly!
I am willing to improve this spreadsheet if you decide to adopt it and find it useful. Just leave a comment with what you like, don’t like and I will definitely get back to you.
| Version | Release Date | Description |
| 1.00 | 1/22/2019 | This is the first public version of this spreadsheet released on the blog |
What about you? Are you tracking your expenses while you are traveling? If so what tools and processes are you using? Do you think your solution is much better (or much easier to use) than ours? Would you be willing to share it for free with our community? If so, feel free to leave us a comment below.





7 Comments
Alison · January 25, 2019 at 10:21 pm
Can’t wait to dig into this sheet. Thanks for sharing it on Google docs. Cheers!
Alison
Instagram: @alloptionsconsidered
Mr. Nomad Numbers · January 26, 2019 at 12:26 am
You are very welcome Alison. Let us know if you find it handy and if there is anything we can improve it with to make it even more useful 🙂
Amy · January 30, 2019 at 9:35 pm
I account for every penny we spend on an Excel spreadsheet. Each trip gets its own and I include lots of details (what we ate, the names of subway stations, who we met, etc.). It takes up to an hour each day if it’s been a busy touristy sort of day. Things are captured every day but if I want to see dining out or groceries, I’d have to go through manually (so I rarely do that). Just downloaded Splitwise. I’ll still do the Excel sheet but hoping to get more data from the app. After I’m done with Part #1, I’ll reach out to figure out Part 2. 🙂
Mr. Nomad Numbers · January 30, 2019 at 10:00 pm
Wow 1 hour. That sounds like a lot of time you can’t spend enjoying your vacation. We started tracking our expenses using a Notepad app from our phone as we wanted to capture the expense ASAP. It requires a lot of work. Once we discovered Splitwise we could not go back and I’m confident you might say the same with Excel. You will see that the app let you capture a bunch of information and split your expenses by trips/groups/categories.
Excel is still better than Splitwise when it come to reporting, which is why we chooses it for Part #2 of our process. Once you get there, definitely let us know if there are things our spreadsheet isn’t doing as I will be happy to improve it if this can benefit our blog community.
Susan Steinbrecher · May 28, 2020 at 12:29 am
Budgeting and spreadsheets make my eyes glaze over, but, I know I must learn to use and prepare one for myself. I would love to see your cost of living/budget tracking spreadsheet. It is my goal to be a full time Senior Nomad! I would also be interested in any other apps that might work for me, a retired 60 year old US citizen. Thanks!!!
Mr. Nomad Numbers · May 28, 2020 at 8:20 am
Hi Susan. It’s exciting to know that you plan to become a full time senior nomad while being retired at 60!
About our tracking spreadsheet, there is a form on this article that you can fill out with your email address so that we can email it to you. As for others apps/ressources we use, check out our ressources page that included the most essential ones: https://www.nomadnumbers.com/ressources/. And let us know if there is anything else we can help you with!
Mr. Nomad Numbers · November 7, 2023 at 3:16 pm
Hi Rosie. There is a form on that page where you can provide your email address and if should send you a copy of our sheet. If not, please send us an email (our info is on the contract page).
Also since we published this post we have created our own budget tracking tool that you can use as well. To learn more about our tool check https://www.nomadpurse.com